Questions Answered: Is the Team Approach to Safety™ Really Effective?
As we’ve looked at the different components of the Team Approach to Safety™, there seems to be one looming question: Is this process effective? As an organization adopts a Team Approach to Safety™, will there be performance improvement?
It’s necessary to be results-focused to see improvement. Over the past several years, we’ve helped numerous organizations take on a Team Approach to Safety™ and the results are in – yes, this really works. This approach is truly designed to build a culture of safety throughout the organization – involving all levels for maximum return. Building a culture of safety is the best way to be results-focused. Long-term success requires a long-term mindset.
As an organization adopts the Team Approach to Safety™, there are a few significant returns:
-
Decrease in Recordable Measurements
- One of the easiest ways to measure a return on safety is through data – specifically Total Recordable Incident Rates and Experience Modification Rates. The graphs below show a significant decrease in these measurements over several years.

- Total of 92% decrease in Total Recordable Incident Rates over 4 years.

- Total 37% Reduction in EMR in 5 Years
- One of the easiest ways to measure a return on safety is through data – specifically Total Recordable Incident Rates and Experience Modification Rates. The graphs below show a significant decrease in these measurements over several years.


-
Increase in Employee Engagement
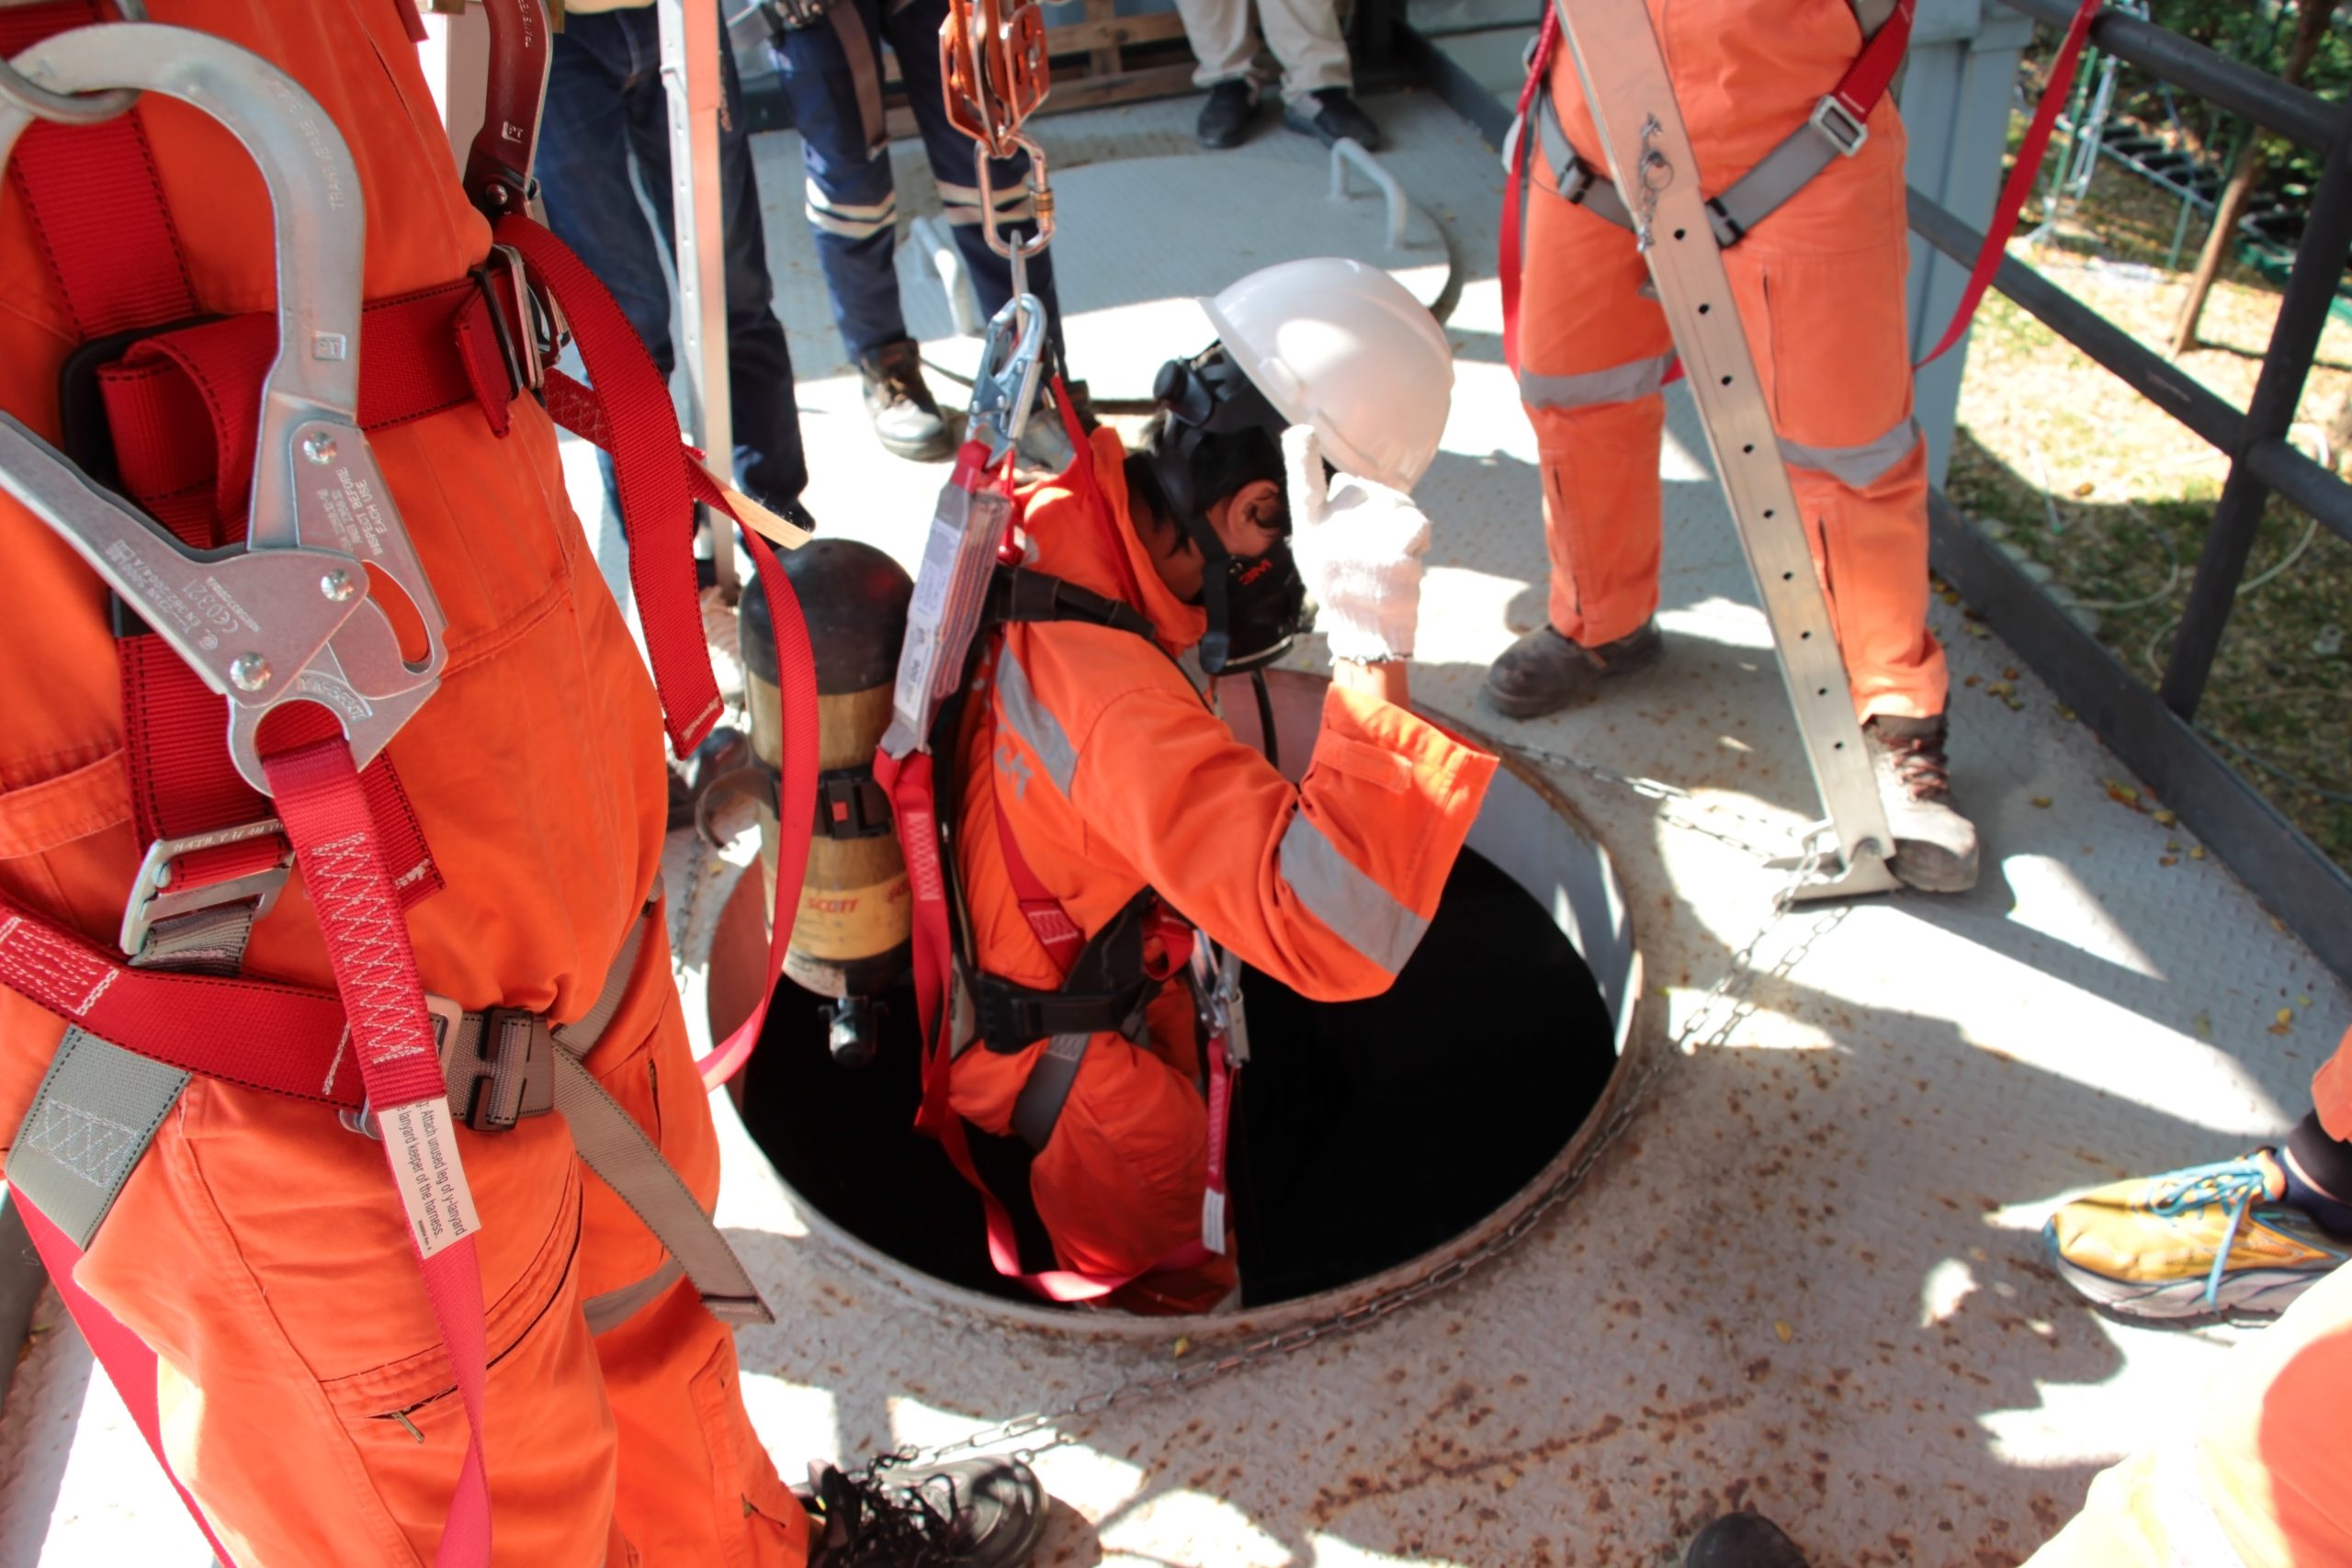
- As employees are involved in the process, they will become more engaged in the workplace. Often injuries in the workplace are a result of unengaged employees. As mentioned in this article, Safety Team Members can be charged with responsibilities such as running monthly tool box talks, training sessions and daily procedures. Allowing front-line workers to become engaged, demonstrates a level of trust in the people and the process. When these employees are well-equipped and invested in, they will lead others to value safety and engage in the process.
-
Reduced Gaps in the Safety Management System
- One of the ways we measure an organizations safety system’s health, is through our SMS Assessment tool. This tool measures 30 Key Performance Indicators (KPIs) and places them on a spider graph (shown below). With the influence of the Team Approach to Safety™, the KPIs go from being scattered across the graph to controlled in the center – indicating reduced variation in performance. This visually and analytically measures a systematic improvement (leading indicators) with a resulting decrease in TRIR and EMR (lagging indicators).


Looking to learn more about the Team Approach to Safety™ or how you can get started today? Contact us and one of our team members will reach out to start a conversation.
Related Article:
5 Steps to Build a Safety Leadership Team